Price Action vs. Indicators
Indicators are just math on price you already have. Here's why I trade naked charts on NQ and what actually replaced every squiggle on my screen.
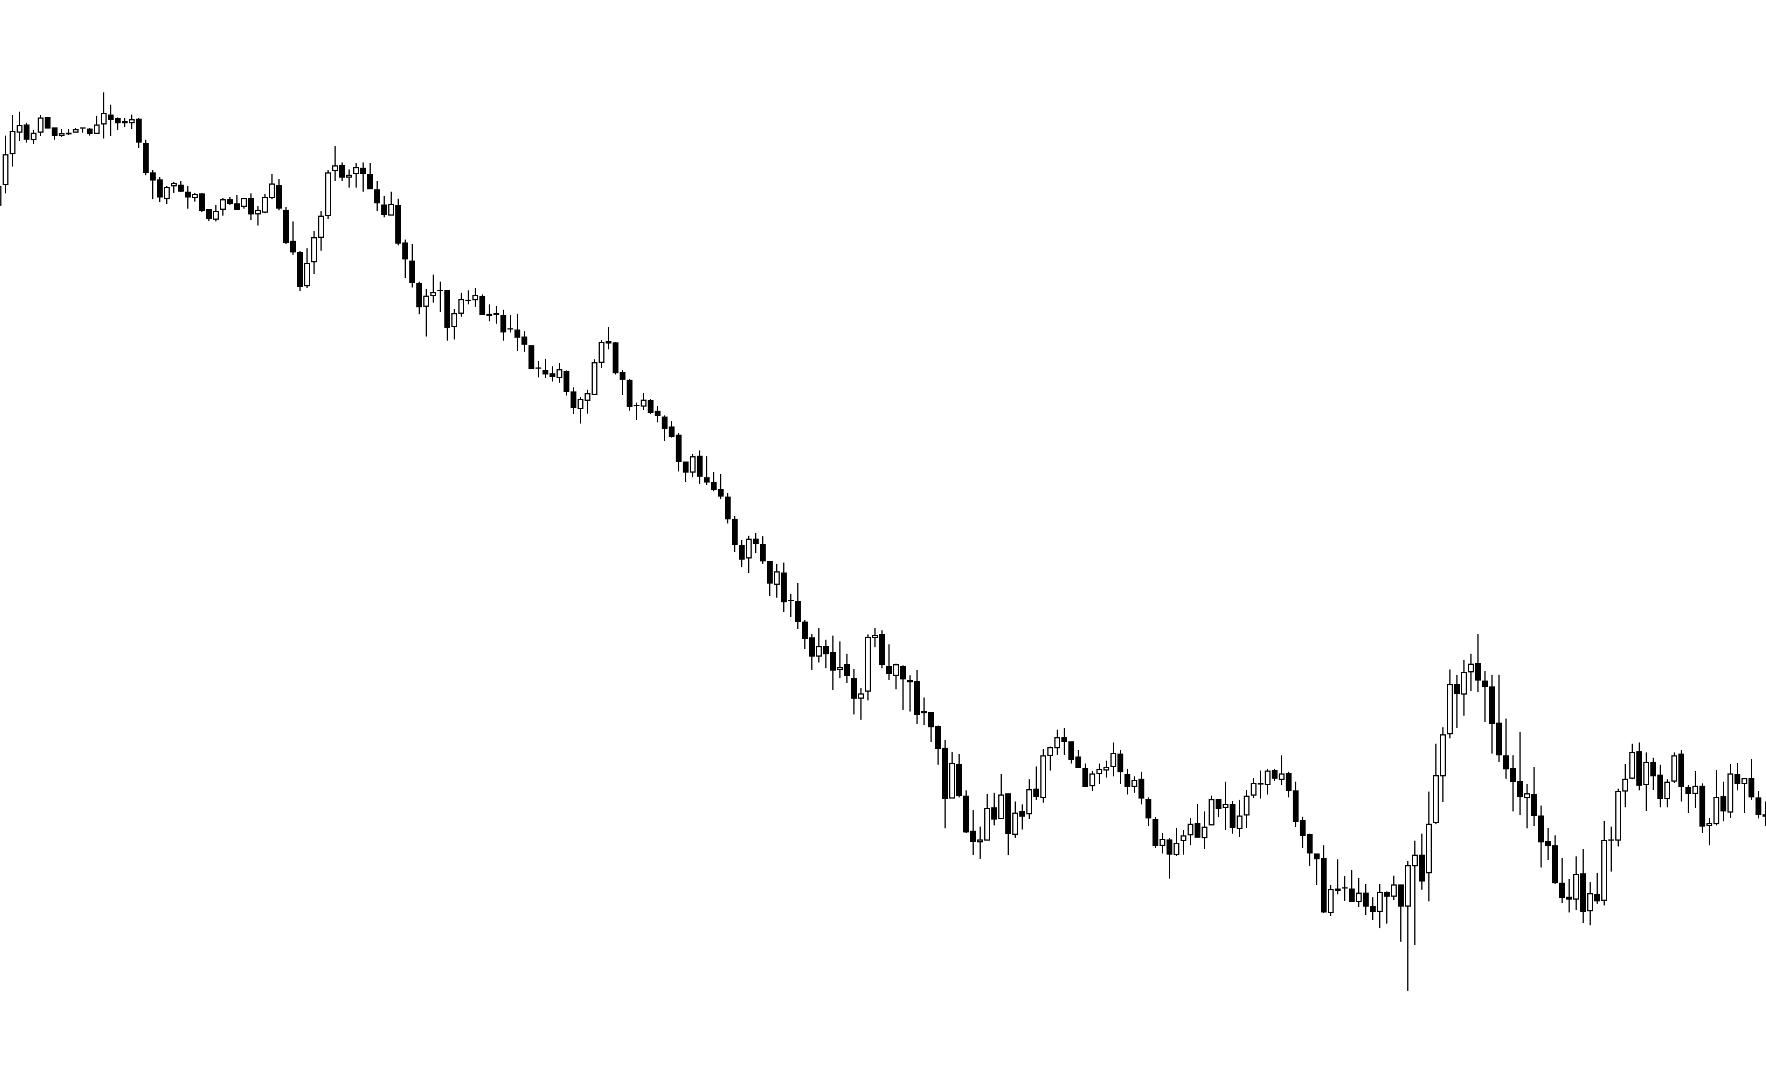
Every indicator on your chart is math done to price you already have. That's it. It's a lagging summary of the candles sitting right in front of you.
RSI, MACD, stochastics, moving averages, VWAP, Ichimoku, whatever — they're all derived. Price prints first. The indicator prints after. You're reading the receipt instead of watching the transaction.
Why I dumped every one of them.
For a couple years I had the whole zoo on my chart. Two EMAs, VWAP, RSI at the bottom, MACD under that, volume profile on the side. I told myself I was "confirming." I was really just looking for an excuse to click.
You know what a stack of indicators does when a trade goes for you? Nothing. You know what they do when a trade goes against you? Everything. Because indicators are never wrong after the fact. Just like candlesticks.
What actually replaced them.
A naked chart on NQ. Candles. Horizontal lines at levels I marked at significant areas of Support & Resistance, sometimes. That's the whole screen. When a candle closes strong, that's all I really care about. When it doesn't, I sit there because the market is probably unsure.
There's no confirmation to wait for. The candle is the confirmation. It closed where it closed. The market told you, in one bar, everything a lagging line would tell you three bars from now.
Indicators aren't evil. They're just noise for me.
Some people trade indicators fine. I'm sure someone out there is making money with a 9-EMA and vibes. But most retail traders I've watched load up their chart until they can't see the actual price and wonder why they're confused for years. It's not true analysis. It's denial and fear.
If you took every indicator off your chart tomorrow and felt anxious, that's the tell. You weren't trading price. You were hiding behind a baby blanket.
Try it for a week.
Delete everything. Just candles and a few horizontal lines. Mark two or three levels before the open if you even want to do that much. Watch how price reacts when each candle closes. Watch how many times price returns to the closes and reacts. You'll see what I'm talking about under the logic and psychology of the market.
You'll trade less and smarter. That's the point.
One candle. One signal. No indicators.
See The System →Past performance is not indicative of future results. Trade at your own risk.